Notices

Title
Improved Statistics Menu
Date
2018-09-03 07:19:17
Attached File

Dear Seller,


This is the Galaxy Apps Seller Office Team.


Thank you for your continued support of the Galaxy Apps Seller Office.


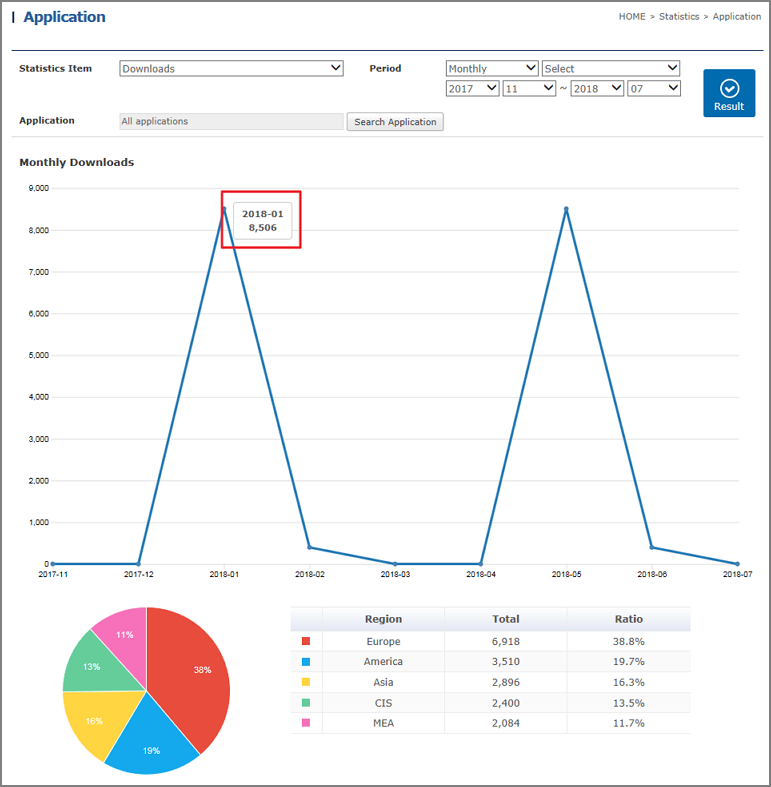
We'd like to inform you that the Statistics menu in Seller Office has been improved as described below.

We hope the improved Statistics menu will help you manage your applications and establish marketing strategies more easily. 


1. Main improvements


1) Line graphs and pie charts now available
You can now view the Downloads and Sales Amount information for a certain period as a line graph at a glance,

and view a filtered result represented in a pie chart.

Placing the mouse over a graph displays the corresponding period and the data corresponding to that period.


2) A variety of filters now available
You can view the Downloads and Sales Amount information by applying different filters such as Device Group, Service Type, Free/Paid, App Version,

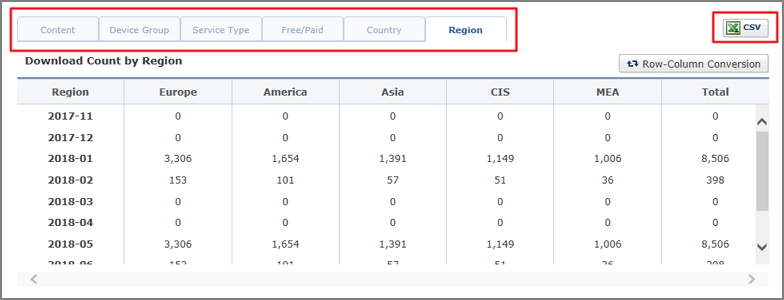
Country, Region, Item Type, or Auto-recurring Subscription Payment Type.


3) CSV files now downloadable
You can search for data and download the data as a CSV file. 


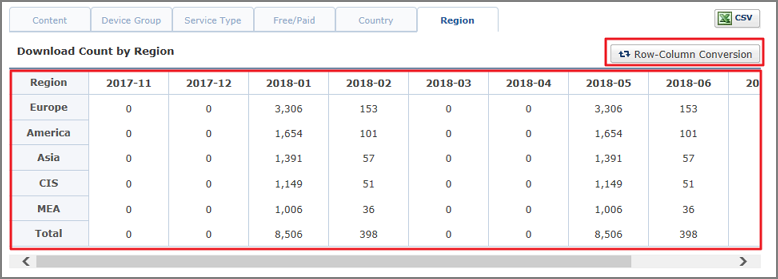
4) Row-Column Conversion now available
You can transpose data in a table applied with filters from rows to columns or vice versa, and then view it.


2. Effective date
  - Aug 28, 2018


If you have questions, select Seller Office > Support > Contact us for inquiries.


Thank you.


Seller Office Team

Notices

OK

close

Notices

Your session will expire soon. You will be signed out in 10 minute. Click [OK] to extend your session.

OK

close

Notices

Your session has expired. Please sign in again.

OK

close